Polytope manipulation example: Minkowski sum and intersection
This example shows how to manipulate polytopes using the pycapacity package.
In particular, it shows how to perform Minkowski sum and intersection of polytopes using the Polytope object’s operators + and & respectively.
from pycapacity.objects import Polytope # import polytope object
import numpy as np

# this seed is used to generate the same image
# as in the examples in the docs
np.random.seed(12345)

N = 10 # hundred vertices
m = 3   # space dimension

points1 = np.array(np.random.rand(m,N))*2-1 # points
points2 = np.array(np.random.rand(m,N))*2-1 # points

# create a polytope object
p1 = Polytope()
p1.find_from_point_cloud(points1)
p2 = Polytope()
p2.find_from_point_cloud(points2)

# plotting the polytope
import matplotlib.pyplot as plt
from pycapacity.visual import * # pycapacity visualisation tools

fig = plt.figure(4)
# draw polytopes
plot_polytope(plot=fig, polytope=p1, label='polytope p1', face_color="blue", edge_color='black',  alpha=0.2)
plot_polytope(plot=fig, polytope=p2, label='polytope p2', face_color="red", edge_color='black', alpha=0.2)
plt.legend()
plt.show()
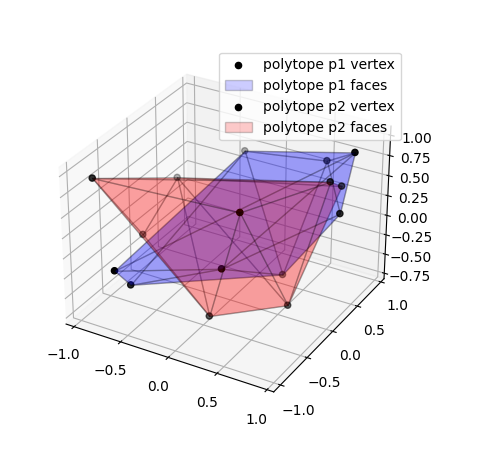
The output of the code is a visualisation of the two polytopes

Minkowski sum of polytopes
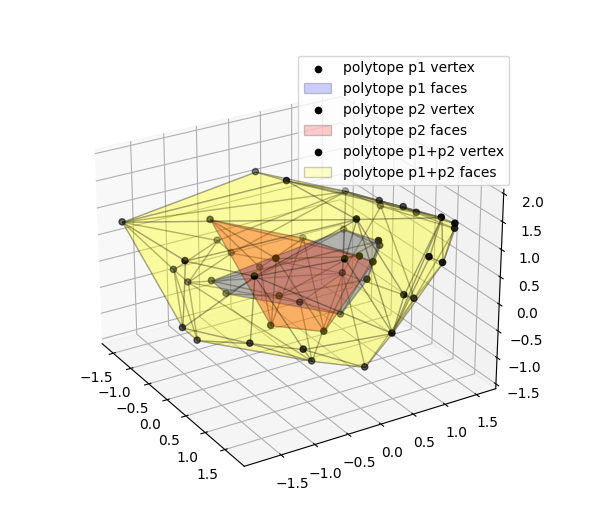
pycapacity package allows to perform Minkowski sum of polytopes using the operator +. So p1 + p2 will return a new polytope object which is the Minkowski sum of p1 and p2 defined as \(p_{sum}=p1\oplus p2\)
# calculate the Minkowski sum of p1 and p2
p_sum = p1 + p2

# plotting the polytope and the points
fig = plt.figure(5)
# draw polytopes
plot_polytope(plot=fig, polytope=p1, label='polytope p1', face_color="blue", edge_color='black',  alpha=0.2)
plot_polytope(plot=fig, polytope=p2, label='polytope p2', face_color="red", edge_color='black', alpha=0.2)
plot_polytope(plot=fig, polytope=p_sum, label='polytope p1$\oplus$p2', face_color="yellow", edge_color='black', alpha=0.2)
plt.legend()
plt.show()
The output of the code is a visualisation of the two polytopes and the Minkowski sum polytope

Intersection sum of polytopes
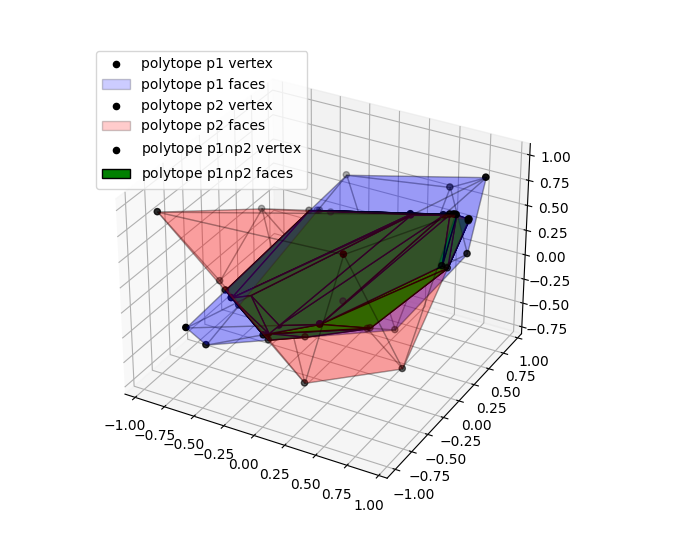
pycapacity package allows to calculate the intersection of polytopes using the operator &. So p1 & p2 will return a new polytope object which is the intersection of p1 and p2 defined as \(p_{sum}=p1\cap p2\)
# calculate the intersection sum of p1 and p2
p_int = p1 & p2

# plotting the polytope and the points
fig = plt.figure(5)
# draw polytopes
plot_polytope(plot=fig, polytope=p1, label='polytope p1', face_color="blue", edge_color='black',  alpha=0.2)
plot_polytope(plot=fig, polytope=p2, label='polytope p2', face_color="red", edge_color='black', alpha=0.2)
plot_polytope(plot=fig, polytope=p_int, label='polytope p1$\cap$p2', face_color="green", edge_color='black', alpha=1)
plt.legend()
plt.show()
The output of the code is a visualisation of the two polytopes and the intersection polytope
